
Burgers, Budgets, and the Cost of Summer
What the Big Mac Index Can Teach Us This Memorial Day Weekend
WEEKLY BLOG POST • MEMORIAL DAY EDITION 2026
Memorial Day weekend is first and foremost a time to remember and honor those who gave their lives in service to our country.
It is also, in a much lighter but very real sense, the unofficial start of summer.
For many families, that means road trips, backyard barbecues, graduation parties, camps, weddings, Shore weekends, flights, hotels, and a calendar that suddenly gets more expensive. This year, AAA projects that 45 million Americans will travel at least 50 miles from home over Memorial Day weekend, setting a new record for the holiday period. That includes 39.1 million people traveling by car and 3.66 million flying.
That says something important about the American consumer.
People are still spending. Families are still prioritizing experiences. Travel is still a meaningful part of life, even after several years of higher prices, higher interest rates, and a more complicated economic backdrop.
But spending does not always mean people feel comfortable.
That is the tension many households are living with right now. The vacation may still happen. The barbecue may still be hosted. The kids may still go to camp. The family may still make the drive down the Shore. But the cost of doing those things feels different than it did a few years ago.
And sometimes, the easiest way to understand a complicated economy is through something very simple.
Like a burger.
The Big Mac Index: A Lighthearted Idea with a Serious Lesson
In 1986, The Economist created what became known as the Big Mac Index.
The idea was simple: because McDonald’s sells a broadly similar Big Mac in countries around the world, the price of that burger can offer a lighthearted way to compare purchasing power across currencies. It was never meant to be a perfect economic model. A Big Mac is not a full household budget. It does not capture housing costs, taxes, healthcare, education, insurance, or savings needs.
But that is exactly why it works as a teaching tool.
Everyone understands the idea.
If the same basic item costs meaningfully more in one place than another, your money does not stretch the same way in both places. That is purchasing power. And while the Big Mac Index is usually used to compare countries, the broader lesson applies much closer to home.
A dollar does not feel the same in every household.
It does not feel the same in every town.
It does not feel the same at every stage of life.
And it certainly does not feel the same after several years of cumulative inflation.
That was the point of last week’s discussion about inflation changing shape. Inflation is not just one number. It moves through the economy unevenly. It shows up differently for a young family paying for childcare, a high earner trying to build wealth, a small business owner managing margins, and a retiree drawing from a portfolio.\
The Big Mac Index gives us a simpler way to say the same thing: the number matters, but the lived experience matters too.
Where Are You Feeling Summer Inflation the Most?
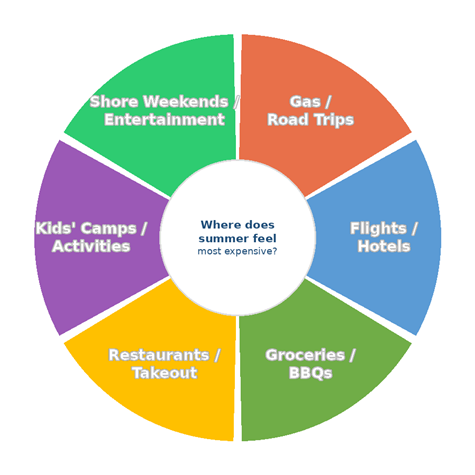
Inflation does not show up the same way for every household. The official data may tell us where prices are moving, but each family feels the pressure in its own spending pattern.
Source: U.S. Bureau of Labor Statistics, Consumer Price Index — April 2026; AAA Memorial Day Travel Forecast, May 2026.
Reader Poll: Which summer cost has surprised you the most this year?
- Travel
- Food and restaurants
- Kids’ activities or camps
- Gas and transportation
- Entertainment
- Everything, honestly
Why the Cost of Summer Feels Different
The latest Consumer Price Index showed prices up 3.8% over the prior 12 months as of April 2026. That is not the kind of inflation shock households felt in 2021 and 2022, but it is still above the Federal Reserve’s long-term comfort zone and still being added on top of the higher prices families already absorbed over the last several years.
That last part is important.
When people hear that inflation is “coming down,” they often think prices are coming down.
Usually, that is not what it means.
It means prices are rising more slowly. The higher price level often remains.
That is why the family grocery bill may still feel high. It is why restaurant meals may still feel expensive. It is why a hotel room, summer rental, car insurance premium, camp deposit, or airline ticket can still produce sticker shock.
The official data can be accurate, and the household experience can be accurate at the same time. They are simply measuring different things.
The data measures averages.
Families live in specifics.
For a family in New Jersey or the broader tri-state area, summer spending is rarely one isolated expense. It tends to arrive all at once. There may be a graduation party, a Shore weekend, a sports tournament, a wedding, a college visit, a camp balance, and a family vacation all landing in the same few months.
None of those decisions may be irresponsible on its own.
Together, they can quietly change the math.
The Burger Is Not the Point. The Pattern Is.
Nobody needs a financial advisor to tell them a burger costs more than it used to.
What is harder to see, and more useful to understand, is the pattern underneath the price. The way a handful of individually reasonable decisions can quietly compound into a cash flow problem. The way the summer months in particular have a habit of arriving all at once. The way a family can look responsible on paper and still feel stretched in practice.
That is what the Big Mac Index is really pointing at, even if it does so with a smile.
A single price is just a number. What matters is what it reveals about purchasing power. How far your dollar actually goes relative to your income, your obligations, your cost of living, and your goals. For some households, a summer of travel and celebrations is well within reach. For others, the same calendar produces real financial stress. The official inflation rate does not distinguish between the two. Your personal financial plan has to.
This is worth thinking about before the season is already underway.
It is not about skipping the Shore weekend or canceling the family vacation. It is about going in with clear eyes. Knowing which expenses are coming. Having a sense of the total, not just each individual line item. Building some buffer for the things that always cost more than expected.
The families who tend to feel least stressed about summer spending are not necessarily the ones with the highest incomes. They are the ones who planned for the season as a season, rather than a series of individual purchases that somehow arrived at the same time.
That kind of planning is exactly what a good financial advisor helps with. Not just investment portfolios and retirement projections, but the practical, ground-level questions: What is actually coming in the next three months? What have we committed to, and what is still flexible? Where are we most likely to go over budget, and what do we do if we do?
The Big Mac Index was never really about burgers.
It was about understanding what your money can actually do, and building a plan around that reality.
Sources
U.S. Bureau of Labor Statistics – Consumer Price Index, April 2026 – Monthly CPI release showing prices up 3.8% year-over-year as of April 2026.
https://www.bls.gov/news.release/cpi.nr0.htm
U.S. Bureau of Labor Statistics – CPI Overview – Background on how the Consumer Price Index is calculated and what it measures.
AAA – Memorial Day Travel Forecast, May 2026 – projects 45 million Americans will travel 50+ miles from home over Memorial Day weekend, including 39.1 million by car and 3.66 million by air.
The Economist – The Big Mac Index – The original and ongoing interactive tool for comparing purchasing power across countries using the price of a McDonald’s Big Mac.
https://www.economist.com/big-mac-index
The Economist – “Big Macurrencies” September 6, 1986 – The original article introducing the Big Mac Index as a lighthearted guide to whether currencies are at their “correct” level.
https://www.economist.com/finance-and-economics/1986/09/06/big-maccurrencies
Federal Reserve – 2% Inflation Target Explainer – The Federal Reserve’s explanation of its long-run 2% inflation goal and how it guides monetary policy.
https://www.federalreserve.gov/faqs/economy_14400.htm

About Amit: I am a first generation American, the son of a working-class Indian family, and I lived through my parents’ struggle to find their place in this country, to put down roots that would sustain them as well as their children in a new land. As they encouraged me to excel in school and fostered my hobbies and interests, I was keenly aware of the dynamic between them. I understood that there was a difference between where they came from individually and where we were now. They worked hard in their individual capacities, but they weren’t always on the same page about financial issues – and that can make or break a family’s future. I didn’t know it at the time, but this laid the groundwork for my passion towards financial services and helping families succeed.