
by Jeff Deiss
CFP, AEP, Wealth Advisor
A colleague of mine made a statement years ago that I never forget. He said, “I don’t know why investors are so focused on beating the S&P 500. You can’t retire on the S&P!”
I’ve thought about his statement ever since. In fact, it’s difficult for me to avoid. The financial services industry and the media focus so much on manager performance relative to the S&P 500 Index as a stock market “benchmark” that it has become a primary driver of how many individual investors’ make investment decisions.
Indexes were originally developed as tools for consultants to effectively evaluate the return performance of institutional money managers used by tax-deferred, defined benefit pension plans. Today, there is a tremendous amount of emphasis placed on index performance by individual investors and this is really our own fault as an industry.
From a practical standpoint, and given all of the variability in individual investor profiles, beating the S&P 500 is not the primary investment objective for most individual investors.
To be fair, our industry doesn’t provide a lot of education around even basic things like the construction of indexes. The S&P 500 Index, for example, is not an equal weighting of 500 stocks, but rather it’s concentrated in a handful of the largest companies trading on U.S stock exchanges, often more expensive stocks trading at high P/E ratios. If this is part of your portfolio, do you really know what you own? As this handful of companies goes, so goes the index and therefore your portfolio. And if this is the case, what the heck is in all of those other funds you own?
Industry marketing also neglects to point out that indexes don’t have fees or pay taxes, yet these are always a consideration for individual investors. The S&P 500 also includes companies that pay no dividends, which results in an index dividend yield of about 1.9% today, and which is often less than the level of income desired by our clients in retirement. Lastly, if there are companies that you would rather not own (for social, environmental or other personal reasons), an index fund leaves you with no choice on this issue.
Given that you pay taxes, you may want some income, and you may be looking for a diversified portfolio reflecting your values, is it realistic to compare your own investment experience to an index when you consider these basic facts?
Focus instead on the right outcome
I’ve always said that even the best investment management can be ruined by poor planning. And an index is not a personal financial objective. As a result, most of our clients have a plan that is designed with a projected rate of return or a portfolio withdrawal rate in mind. Ultimately, your portfolio should be constructed with specific goals in mind in order to achieve your personal objectives with a tolerable amount of risk so that you’ll stick with it and stay invested. This is the key to long-term investment success.
For many who are at, near or in retirement, a better path to investment success is often obtained through a balanced portfolio. While we know that stocks do better than bonds over the long-term and that bonds do better than cash over the long-term, very few of us can stick to a 100% equity portfolio during periods of market volatility.
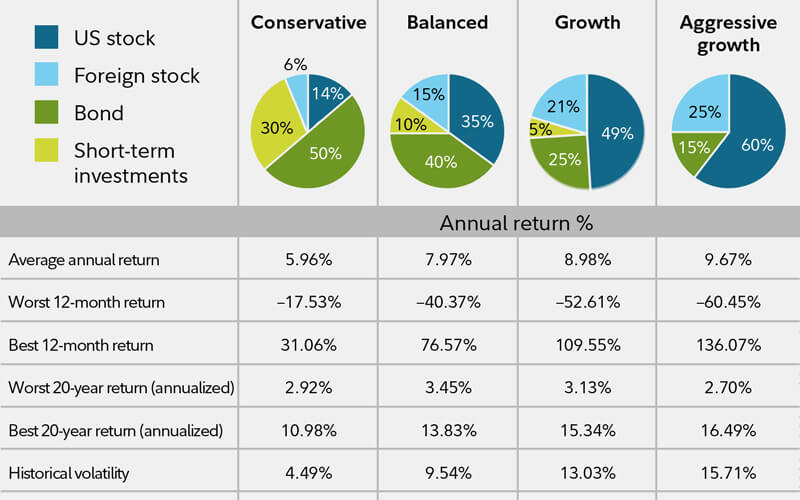
Data source: Morningstar, 2019 (1926-2018). Past performance is no guarantee of future results. Returns include the reinvestment of dividends and other earnings. This chart is for illustrative purposes only and does not represent the actual or implied performance of any investment option.
The good news is that, during the worst long-term periods of time (the “worst 20-year annualized returns” above), a more balanced portfolio actually did a better job for investors. Longer time frames simply reinforce these results. For those investors who recognize this and who have a plan with their personal goals in mind, very few are expecting their portfolio to mirror an index. They recognize that they can’t “retire on the S&P 500”.
What lies ahead
No one can consistently or persistently predict what the markets will do in the future. In the “lost decade” ending in 2009, for instance, stocks averaged annualized returns of negative -3% and lagged bonds by more than 9%. Bond lovers, however, are now in their tenth year of persistently low-interest rates. In 2007, 10-year Treasuries were yielding 5%, but recently they have dipped below 2% again. In contrast, the S&P 500 Index is enjoying a ten-year annualized return of 14.7% (through June 30, 2019).
Finally, taxes should also be taken into consideration when evaluating investment performance over time. Investors (and Advisors) have historically evaluated success based on the rate of return seen on their statements compared to an index. Again, these numbers don’t take taxes into account. Each year, investors can lose quite a bit of their return to taxes. And bad planning may make it worse. In 2018, 91% of U.S. equity mutual funds had a negative return, yet 86% paid out an average capital gains distribution of 11%1.
Whether it’s taking withdrawals from the right accounts, harvesting tax losses, Roth IRA conversions, bunching charitable deductions or making qualified charitable IRA distributions, there are personal tax considerations that may affect your personal portfolio performance that have nothing to do with the performance of a specific index.
Construct your portfolio for your objectives
One of the benefits of a diversified portfolio of bonds and stocks is that it is more likely to dampen volatility and enhance long-term returns when the markets are making your stomach queasy or just exasperating you. While market volatility is the risk with equities, inflation and a loss of purchasing power as well as interest rate risk accompany a portfolio that’s crammed with bonds.
A diversified portfolio is less vulnerable to the significant risks that occupy either end of the risk spectrum. Your best protection for achieving your financial goals in the face of unpredictable financial markets is to focus first on the outcome you need and then implement an investment strategy that considers your personal objectives – your need for income and growth, your financial and tax situation and your risk tolerance.
In the end, and despite what the industry preaches, to us it’s helping you achieve your desired outcome that matters most.
1 Morningstar broad category ‘US Equity’ (large/mid/small V/B/G) which includes mutual funds and ETFs (and multiple share classes). Average U.S. equity fund Distribution: Capital Gains/Share (% of NAV) based on Morningstar U.S. OE Mutual Funds and ETFs. % = Calendar Year Cap Gain Distributions / Year-End NAV. Distribution is assumed to be made at last day of the year and reinvested. Tax rate is 23.8% (Max LT Cap Gain 20% + Net Investment Income 3.8%).
ACM is a registered investment advisory firm with the United States Securities and Exchange Commission (SEC). Registration does not imply a certain level of skill or training. All written content on this site is for information purposes only. Opinions expressed herein are solely those of ACM, unless otherwise specifically cited. Material presented is believed to be from reliable sources and no representations are made by our firm as to another parties’ informational accuracy or completeness. All information or ideas provided should be discussed in detail with an advisor, accountant or legal counsel prior to implementation. All investing involves risk, including the potential for loss of principal. There is no guarantee that any investment plan or strategy will be successful. ©ACM Wealth