

When Good Economic News Becomes Bad Market News
WEEKLY BLOG 09/17/26

On Friday, September 4, the Bureau of Labor Statistics reported that the U.S. economy added 162,000 jobs in August. Economists had expected roughly 53,000. The unemployment rate held at 4.1%.
Stocks fell.
If you read that and thought, “Wait, that makes no sense,” you are asking the right question. The answer explains a lot about how markets actually work, and right now, it starts in the bond market.
More Jobs Is Good. Full Stop.
More people working is unequivocally a good thing. More jobs mean more income, more economic activity and generally a healthier economy.
And the August report was not just a strong headline number. June payroll growth was revised up from 20,000 to 31,000, while July was revised from a loss of 23,000 jobs to a gain of 21,000. Combined, those two months were 55,000 jobs stronger than previously reported. August’s 162,000 gain was also far above the roughly 31,000 monthly average of the prior year.
The complication is inflation.
Where the Fed Actually Is Right Now
The Federal Reserve has been trying to bring inflation back toward its 2% target, and its primary tool for doing that is interest rates. Higher rates make mortgages, car loans and other forms of borrowing more expensive. They increase financing costs for businesses and make some investments less attractive. Collectively, that tends to slow demand and take some heat out of the economy.
The important part is that the Fed has not changed its policy rate all year. The federal funds target range has remained at 3.50% to 3.75% since January. At its July meeting, the Fed again left rates unchanged, although three members dissented in favor of a quarter-point increase.
For much of 2026, the market debate centered on when the Fed might be able to cut. Investors were hoping for a fairly clean sequence: economic growth gradually cools, the labor market softens, inflation keeps falling and the Fed finally has room to lower rates.
That is no longer the only debate.
Energy has complicated the picture significantly. Higher oil prices have created another potential source of inflation at exactly the moment the Fed is trying to finish the job. So the question investors are wrestling with has shifted from simply, “When does the Fed cut?” to something much less comfortable:
Does the Fed actually need to raise rates again?
That was the backdrop against which the 162,000 jobs number landed.
Why a Strong Jobs Number Made Investors Nervous
If the labor market were deteriorating rapidly, the Fed would have a strong reason to be cautious about tightening monetary policy. A weakening jobs market acts as a natural brake.
A strong employment report removes some of that brake.
To a bond investor, good news about the economy can therefore mean something very specific. If employment remains healthy while inflation stays stubborn, the Fed has more room to fight inflation without immediately worrying that tighter policy will push the labor market over a cliff.
That changes the expected path of interest rates.
The market was not upset that 162,000 Americans got jobs. It was reacting to what those jobs changed about the range of possible outcomes for the Fed meeting on September 16 and the meetings that follow.
That distinction matters.
The Inflation Report Wasn’t a Disaster. That’s Important.
The August CPI report, released on September 11, added the next piece of the puzzle. There is real nuance here.
Consumer prices increased 0.4% in August and were 3.4% higher than a year earlier. The headline numbers were roughly in line with expectations. Energy was an important contributor to the monthly increase.
So it would be an exaggeration to describe the report as some new inflation shock.
The more interesting number was underneath the headline.
Core inflation, which strips out food and energy, rose 0.3% for the month, compared with expectations for 0.2%. Over the previous 12 months, core inflation was 2.4%.
A difference of one-tenth of one percent in a single month does not sound like much, and by itself it is not. But markets rarely analyze economic reports one at a time. They assemble them.
A stronger labor market is one piece. Inflation still above the Fed’s target is another. Core inflation coming in a little firmer than expected is another. Elevated energy costs create another potential complication.
None of those things individually says “inflation crisis.”
Together, though, they make the path toward lower interest rates harder to see.
And the bond market’s reaction on September 11 told us something particularly interesting about what investors were worried about.
There Isn’t Just One Interest Rate
We tend to talk about “interest rates” as though the Federal Reserve has one giant dial that controls everything from your savings account to your mortgage.
It does not work that way.
The Fed sets a very short-term policy rate. Financial markets determine most of the other rates we encounter.
That distinction matters because different parts of the Treasury yield curve answer different questions.
The 2-year Treasury is especially sensitive to expectations for Federal Reserve policy over the next couple of years. The 10-year has more moving parts. By the time you get to a 30-year Treasury, investors are trying to price inflation, economic growth, government borrowing and interest rates over three decades.
That is why I found the bond market’s reaction to the CPI report more interesting than the headline itself.
According to Treasury’s official closing rates, the 2-year yield rose from 4.56% on September 10 to 4.63% on September 11. The 10-year barely moved, from 4.95% to 4.96%. The 30-year actually slipped from 5.37% to 5.35%.
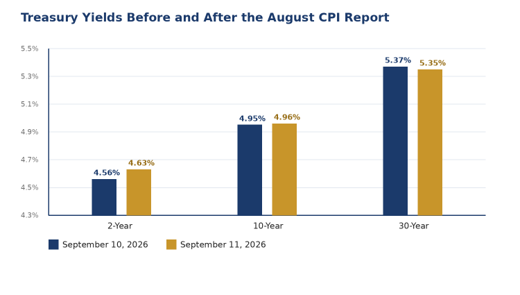
Source: U.S. Department of the Treasury, Daily Treasury Par Yield Curve Rates.
That is a very specific message.
The bond market was not broadly screaming, “Inflation is back. Sell everything.”
If investors had suddenly concluded that long-term inflation had become materially worse, I would have expected a more dramatic move farther out on the curve.
Instead, the largest move was concentrated closer to the front end.
In plain English, the market was primarily changing its view about what the Fed may need to do next, not dramatically changing its view of inflation over the next 30 years.
That tells you far more than simply saying, “Bond yields went up.”
And Stocks Went Up Anyway
Here is where it gets even more interesting.
After several down days, stocks rallied on Friday even while shorter-term Treasury yields were rising and investors were increasing the probability of a Fed rate hike. The S&P 500 and Dow were each up roughly 1% during the session, while the Nasdaq gained even more. Oil prices were also retreating from the levels that had rattled markets earlier in the week.
How can stocks rise while the bond market becomes more concerned about tighter Fed policy?
Because the two markets were not necessarily answering the same question.
Bond investors looked at the strong labor market, the core inflation number and the approaching Fed meeting and concluded that the Fed may have to remain tighter than previously expected.
Stock investors could look at the same report and see something different: inflation was not materially worse than feared, energy prices were easing that day, and the economy still appeared strong enough to support corporate earnings.
Both can be true.
This is where investors get themselves into trouble when they try to reduce every economic report to either “good for stocks” or “bad for stocks.”
Markets are more complicated than that.
What Would You Charge to Lend Your Money Until 2056?
The long end of the bond market has its own story, and it has much less to do with what happens at next week’s Fed meeting.
Think about buying a 30-year Treasury today. You are agreeing to lend the United States government money until 2056.
A lot can happen between now and then.
You do not know what inflation will average over those 30 years. You do not know where interest rates will settle, what economic growth will look like, how large federal deficits will become or how much additional debt the government will have to issue.
If someone asks you to accept all of that uncertainty, a reasonable response is:
Fine. But you are going to have to pay me more.
Bond professionals call some of that additional compensation the term premium.
The phrase sounds technical. The concept is not.
A 3-month Treasury involves relatively little uncertainty about the economic environment between today and maturity. A 30-year Treasury asks an investor to commit capital across multiple economic cycles, presidential administrations, recessions, inflation regimes and geopolitical events.
So a 30-year Treasury yielding around 5.3% does not mean investors believe the Federal Reserve will keep its overnight policy rate near 5% for the next 30 years.
Long-term Treasury yields can broadly be thought of as two pieces: the market’s expectation for the path of future short-term interest rates, plus additional compensation for accepting the risks associated with holding a long-duration bond.
That second piece matters.
Uncle Sam Needs to Borrow a Lot of Money
There is another force affecting long-term interest rates: supply.
The federal government finances deficits by issuing Treasury securities. When spending exceeds revenue, investors have to absorb the additional debt.
At its core, that becomes a supply-and-demand problem.
Think about it like anything else being sold. If ten buyers are chasing five houses, sellers have leverage. If five buyers are looking at ten houses, buyers do.
If the Treasury needs the market to absorb a large amount of new debt, investors may require a more attractive yield before they are willing to buy it.
That adjustment happens through price.
There was a useful example of the distinction this month. Treasury had already announced larger buybacks of older, longer-dated securities beginning September 9. Treasury describes those operations as providing liquidity support in portions of the market where older securities can trade less efficiently. It increased the maximum size of those long-end operations from $2 billion to at least $4 billion.
On September 10, Treasury conducted an even larger operation of up to $6 billion in the 10- to 20-year sector. Yet long-term yields remained elevated.
That is important because buybacks designed to improve market liquidity do not make the government’s overall financing needs disappear.
This is why saying “the Fed is keeping rates high” is too simple an explanation for where interest rates are today.
The Fed matters enormously at the front end of the curve. Longer-term Treasury yields are also incorporating expectations for growth and inflation, federal borrowing needs, the supply of Treasury securities and the additional compensation investors require for committing capital for a long period of time.
The Fed controls an interest rate. The market determines the yield curve.
Five Percent Changes the Math
Imagine I give you two choices.
One is a Treasury backed by the U.S. government paying 2%. The other is the stock market, where you can potentially earn considerably more over time but have to accept volatility and the possibility of real losses along the way.
For a long-term investor, stocks look pretty attractive.
Now change one number.
What if the Treasury pays 5%?
Stocks may still offer the better long-term return, but the hurdle has changed. Investors can suddenly earn a meaningful return without accepting anywhere near the same amount of risk.
In finance, Treasury securities are commonly used as the benchmark for the so-called risk-free rate. That does not mean a Treasury bond is literally free of every type of risk. Inflation matters. Duration matters. If you sell a longer-term Treasury before maturity, its price can move considerably.
But Treasuries provide the reference point against which almost every other asset gets evaluated.
When that benchmark moves from 2% to 5%, the price of risk changes.
If I can earn roughly 5% from a Treasury, I should demand more than 5% to accept credit risk, illiquidity or the volatility of owning a business. Companies also pay more to borrow. Some projects no longer make economic sense. And a dollar of profit a company might earn ten or twenty years from now becomes worth less today when investors discount it using a higher required return.
The bond market establishes the price of money.
And the price of money eventually finds its way into the price of almost everything else.
Five Percent Changes Your Math, Too
Everything above is about markets in the abstract. Let’s bring it closer to home, because for a lot of the families we work with, this is not abstract at all.
Imagine someone planning to leave work in their mid-50s. There may be several years between their last paycheck and the point when they want to rely more heavily on retirement accounts. Although retirement-plan rules include important exceptions that can permit access before age 59 1/2, many early retirees still need a substantial pool of taxable assets to fund that bridge.
For much of the past 15 years, the conservative portion of that bridge earned very little. Cash was often something you held because you needed liquidity, not because it offered an attractive return.
At yields near 5%, that changes.
A Treasury security maturing around the year you expect to need the money can once again be a legitimate planning tool rather than simply a place to park cash.
But this is where the tax return enters the conversation, and it is the part most market commentary skips.
Five percent is not always five percent.
It depends on what is paying it, which account owns it and how that income is taxed.
Interest from U.S. Treasury securities is subject to federal income tax but exempt from state and local income taxes. New Jersey also specifically exempts interest from direct federal obligations such as Treasury bills, notes and bonds. Qualifying New Jersey municipal-bond interest can receive favorable treatment at both the federal and New Jersey level.
So a 5% Treasury, a 5% bank CD and a lower-yielding municipal bond are not necessarily equivalent after tax.
The answer depends on the investor.
It also depends on when the income arrives.
For someone who retires before Social Security and required retirement distributions begin, those lower-income years can be incredibly valuable from a planning standpoint. They may create opportunities for Roth conversions, capital-gain realization or other tax planning.
Every dollar of taxable interest generated during those years uses some of that tax capacity.
That does not make taxable interest bad. It simply means the highest advertised yield is not automatically the best answer.
None of that shows up in a headline about the 10-year Treasury.
It shows up on the tax return.
That is why, when we are doing this kind of planning, the investment account and the tax return cannot be treated as two separate conversations.
Markets Don’t Trade on Good or Bad. They Trade on Better or Worse.
This is the part I hope you remember.
Markets do not simply react to whether something is objectively good or bad. They react to how reality compares with what investors had already expected, and then immediately recalculate what that new information means for the future.
Imagine everyone expects a company to earn $1 billion and it earns $900 million.
Nine hundred million dollars sounds fantastic.
The stock can still fall because investors had already priced in something better.
Economic data works the same way.
More Americans finding jobs is unequivocally good news. But investors had been positioned for a softer economy and a Fed with little reason to tighten. An employment report roughly three times stronger than the consensus estimate changed that calculation.
The CPI report a week later showed the other side of the same lesson. Underlying inflation was a little firmer than expected, shorter-term Treasury yields rose and expectations for Fed tightening increased.
Stocks rallied anyway.
There is no contradiction.
Different markets. Different time horizons. Different questions.
The market is not rooting for unemployment. It is not rooting for inflation. And it is not rooting for the Federal Reserve to raise or lower interest rates.
Markets do not root. They price.
So the next time you see a headline saying stocks fell because more Americans got jobs, do not ask why Wall Street thinks good news is bad.
Ask the better question:
What did this news change about what happens next?
Then ask the question that actually matters for your own financial plan:
What, if anything, does it change about what happens next for you?
Sources
U.S. Bureau of Labor Statistics, “The Employment Situation – August 2026,” September 4, 2026. https://www.bls.gov/news.release/empsit.htm
U.S. Bureau of Labor Statistics, Consumer Price Index – August 2026, September 11, 2026. https://www.bls.gov/cpi/
Federal Reserve Board, July 29, 2026 FOMC Statement. https://www.federalreserve.gov/newsevents/pressreleases/monetary20260729a.htm
U.S. Department of the Treasury, Daily Treasury Par Yield Curve Rates. https://home.treasury.gov/resource-center/data-chart-center/interest-rates/TextView?type=daily_treasury_yield_curve
U.S. Department of the Treasury, “Treasury Announces Increased Sizes of Nominal Long-End Liquidity Support Buybacks Beginning September 9,” August 19, 2026. https://home.treasury.gov/news/press-releases/sb0607
Reuters, September 9, 2026, “U.S. Treasury to buy up to $6 billion in Sept. 10 buyback operation.” https://www.investing.com/news/economy-news/us-treasury-to-buy-up-to-6-billion-in-sept-10-buyback-operation-489409
The Wall Street Journal, September 11, 2026 market coverage. https://www.wsj.com/livecoverage/stock-market-cpi-inflation-09-11-2026
IRS Publication 550, Investment Income and Expenses. https://www.irs.gov/publications/p550
New Jersey Division of Taxation, “Exempt (Nontaxable) Income.” https://www.nj.gov/treasury/taxation/njit12.shtml
IRS, “Retirement Topics – Exceptions to Tax on Early Distributions.” https://www.irs.gov/retirement-plans/plan-participant-employee/retirement-topics-exceptions-to-tax-on-early-distributions
Did you miss our last blog?
The September 15 Deadline That Doesn’t Forgive Guess Work

About Amit: I am a first generation American, the son of a working-class Indian family, and I lived through my parents’ struggle to find their place in this country, to put down roots that would sustain them as well as their children in a new land. As they encouraged me to excel in school and fostered my hobbies and interests, I was keenly aware of the dynamic between them. I understood that there was a difference between where they came from individually and where we were now. They worked hard in their individual capacities, but they weren’t always on the same page about financial issues – and that can make or break a family’s future. I didn’t know it at the time, but this laid the groundwork for my passion towards financial services and helping families succeed.
IMPORTANT NOTICE AND DISCLOSURE
The information and material contained in this communication is confidential and intended for the recipient addressee named. If you are not the intended recipient please delete the message and notify the sender immediately.
NewEdge Advisors, LLC is an Investment Adviser registered with the Securities and Exchange Commission. Any information provided has been obtained from sources considered reliable, but we do not guarantee the accuracy or the completeness of any description of securities, markets or developmentsmentioned. As a precautionary measure, we cannot rely on e-mail requests to authorize, direct or effect the purchase or sale of any security, wire transfer, or to affect any other transactions. Such requests, orders, or other instructions sent by email should be confirmed verbally, prior to their anticipated execution. We are unable to ensure email sent to you from us, or sent from you to us will be received. Please contact us at 845-652-3449 if there is any change in your financial situation, needs, goals or objectives, or if you wish to initiate any restrictions on the management of the account or modify existing restrictions. Additionally, we recommend you compare any account reports from NewEdge Advisors LLC with the account statements from your Custodian. Please notify us if you do not receive statements from your Custodian on at least a quarterly basis. Our current disclosure brochure, Form ADV Part 2, is available for your review upon request. This disclosure brochure, or a summary of material changes made, is also provided to our clients on an annual basis. This material was prepared with the assistance of AI. All content has been reviewed, edited, and approved by Forefront Wealth Planning prior to use. This is general education and not a substitute for personalized tax, legal, or investment advice. Your situation should be reviewed with the appropriate professionals before taking action. Advisory services offered through NewEdge Advisors, LLC, a registered investment adviser.