
The Story the Market Wants to Tell
We all do this.
We create a version of reality that feels better than the actual one. Sometimes it’s optimism. Sometimes it’s avoidance.
Markets do the same thing.
Over the last few years, one of the most popular stories has been that the market is finally “broadening out.” More stocks participating. Less reliance on a handful of names. A healthier foundation.
It sounds right.
It just isn’t what’s happening.
The Hope for a Broader Market
From 2023 through 2025, a small group of stocks did most of the work. A JPMorgan analysis showed that roughly 78% of the S&P 500’s return came from just 42 AI-driven companies, which also accounted for about two-thirds of earnings.
That’s not diversification. That’s concentration.
Coming into 2026, there was a real hope that this would change. And for a brief moment, it looked like it might.
Market Concentration Has Started to Creep Back Up
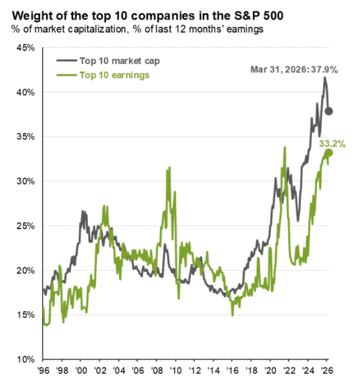
Source: JP Morgan Guide to the Markets, April 2026
This chart shows how concentrated the S&P 500 has become, with the top names making up a growing share of the index. Earlier this year, that number dipped slightly, which gave people hope. That move is already reversing.
Equal Weight vs. Cap Weight Tells the Real Story
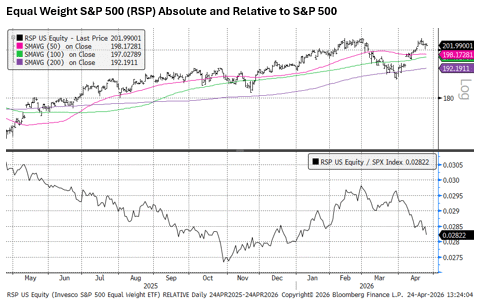
Source: Bloomberg, NewEdge Wealth, 4-24-26
This is one of the simplest ways to see what’s actually happening.
When equal weight outperforms, more stocks are participating. When it underperforms, leadership is narrowing.
Earlier this year, equal weight was outperforming by about 7%. Now that’s down to roughly 1%.
That shift happened quickly. And it tells you the broadening story is already fading.
Markets Follow Earnings. Always.
If you want to understand market behavior, don’t overcomplicate it.
Follow the earnings.
If earnings growth is narrow, market performance will be narrow.
That’s exactly what we’re seeing again in 2026.
Earnings Revisions Are Not Broad
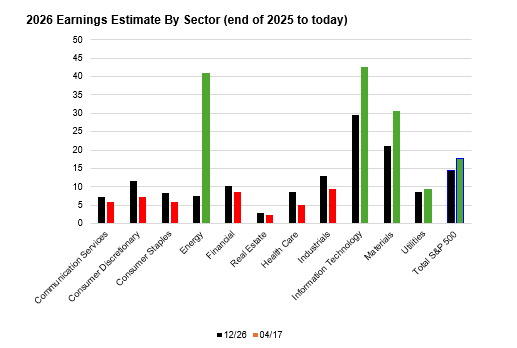
Source: Bloomberg, NewEdge Wealth, as of 4-24-26
This chart shows which sectors are seeing earnings estimates revised higher and which are getting cut.
Only a handful of sectors are improving. Most are flat or getting trimmed.
That’s not broad strength. That’s selective strength.
And when you layer in index weights, it becomes even clearer.
Energy, utilities, and materials are small parts of the index. They don’t move the needle much.
Tech does.
And Even Within Tech, It’s Narrow
The headline number says tech earnings are growing fast.
That’s true.
But it’s not coming from all of tech.
Semiconductors Are Doing the Heavy Lifting
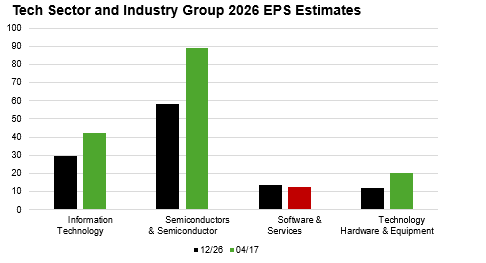
Source: Bloomberg, NewEdge Wealth, as of 4-24-26
This chart breaks down earnings growth inside the tech sector.
Semiconductors are exploding higher. Software is flat to down. Hardware is improving, but it’s tied closely to semiconductors.
So even within the largest sector, the leadership is concentrated.
The “493” Isn’t as Broad as It Looks
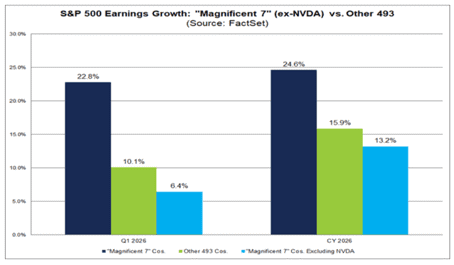
Source: Factset, as of 4-20-24
There’s a narrative that the rest of the market is starting to catch up.
But when you dig into the data, much of that growth is still coming from semiconductor-related names.
Different labels. Same driver.
The Market Is Now a Semiconductor Story
At this point, it’s hard to ignore.
The S&P 500 is more tied to semiconductors than it has ever been.
Semiconductor Weight Has Surged
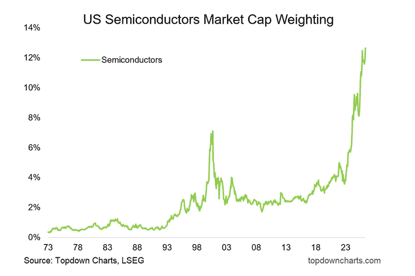
Semiconductors now make up roughly 14% of the index. That’s about double where they were during the tech bubble.
That’s a big shift.
Earnings Have Followed
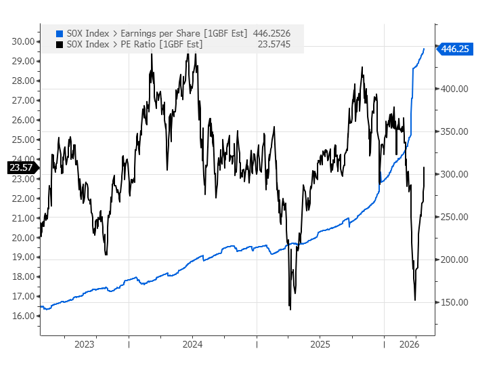
Source: Bloomberg, NewEdge Wealth, as of 4-24-26
The reason for that weight is real earnings growth. This isn’t just speculation. Profits have surged.
That part is legitimate.
But there’s a catch.
Cycles Still Matter
Semiconductors are one of the most cyclical industries out there.
They go through booms. Then they slow down. Sometimes sharply.
Right now, we are clearly in a boom.
Price Action Is Starting to Reflect That
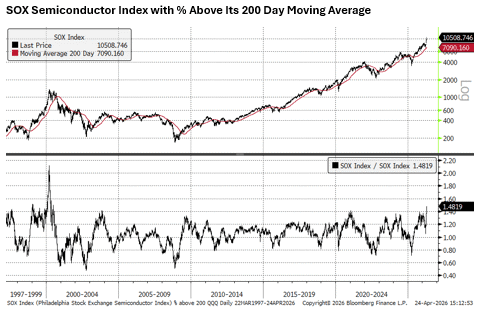
Source: Bloomberg, NewEdge Wealth, as of 4-24-26
Semiconductor stocks have had an incredibly strong move. The index is well above its long-term trend.
That kind of move usually comes late in a cycle, not early.
It doesn’t mean the cycle ends tomorrow. It does mean expectations are high.
And markets don’t need bad news to correct. They just need expectations to get ahead of reality.
What This Means Going Forward
The takeaway here isn’t that something is “wrong” with the market.
It’s that the story being told doesn’t match what’s actually happening.
This is not a broad-based rally driven by a strong, balanced economy.
This is a concentrated rally driven by one powerful earnings cycle.
That cycle has been strong. It may continue.
But over time, it will slow.
And when it does, the same concentration that helped on the way up can work against us on the way down.
Final Thought
The market feels strong right now. That part is real.
But it’s important to understand why it feels strong.
Because if your plan assumes broad participation, you’re solving for a market that doesn’t exist right now.
And that’s where mistakes get made.
Sources
JP Morgan Guide to the Markets, April 2026
Bloomberg data, April 2026
FactSet data, April 2026
NewEdge Wealth Weekly Edge Report, April 2026
|

About Amit: I am a first generation American, the son of a working-class Indian family, and I lived through my parents’ struggle to find their place in this country, to put down roots that would sustain them as well as their children in a new land. As they encouraged me to excel in school and fostered my hobbies and interests, I was keenly aware of the dynamic between them. I understood that there was a difference between where they came from individually and where we were now. They worked hard in their individual capacities, but they weren’t always on the same page about financial issues – and that can make or break a family’s future. I didn’t know it at the time, but this laid the groundwork for my passion towards financial services and helping families succeed.