ALL-TIME HIGH FOR S&P500 – A MISLEADING HEADLINE
Its true, last week the S&P500 hit an all time high, surpassing the level we hit in February, before the Covid crash. However, of the 500 constituents that make up the index, only 6% of those companies are also hitting new 52-week highs.
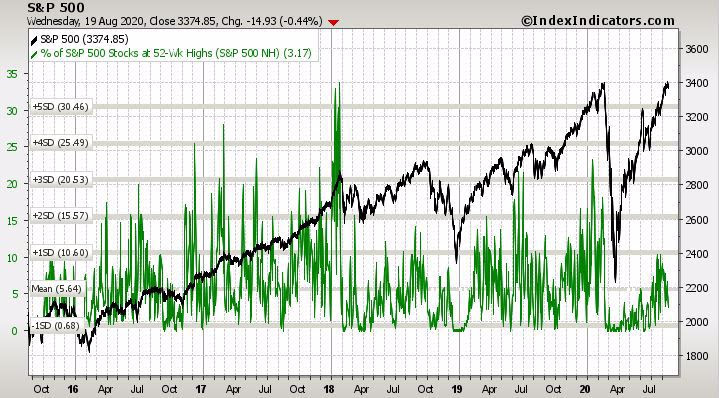
So, what about the other 94%?
This is just news, no noise, so telling the whole story is paramount. The chart and data point above are amazing, but needs some context to make sure it isn’t misleading the way traditional media uses data.
- The median stock is 63% above its 52-week low
- Stocks might not be near their 52-week high, but are also quite far from their 52-week low.
Okay, just tell me how are stocks actually doing?
We know that the S&P500 is influenced far more by the larger FAANG + MSFT stocks but what about everything else?
- The median S&P500 stock is down 3.1% for the year
- 56% of them are above their 200-day moving average
- This isn’t terrible, but not something to write home about
- 64% of the index is underperforming the overall index in 2020
- The Median level of underperformance is -22% (wow)
So What?
So how does this impact all of you?
- Just because the index is up, does not mean the entire market or your portfolios is up
- The larger the company the more it moves an index
- Don’t get caught up in what “the market” is doing, focus on if your portfolio and plan is still on track to meet your goals.
What to look forward to this week
Tuesday August 26th, 2020
New Home Sales @ 10:00AM
Thursday August 28th, 2020
Initial and continuing jobless claims @ 8:30AM
Q2 GDP revision @ 8:30AM
Friday August 29th, 2020
Personal Income for July @ 8:30AM
Consumer Spending for July @ 8:30AM
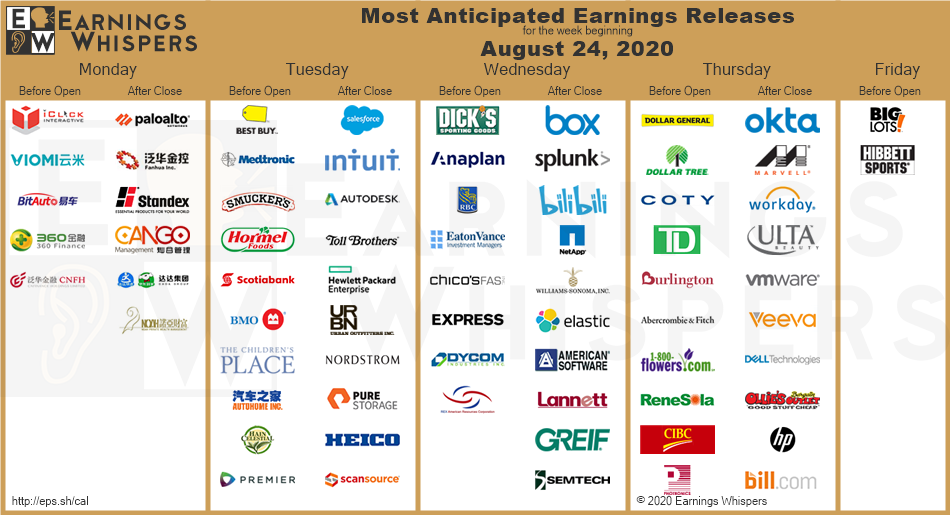
Most anticipated earnings for this week
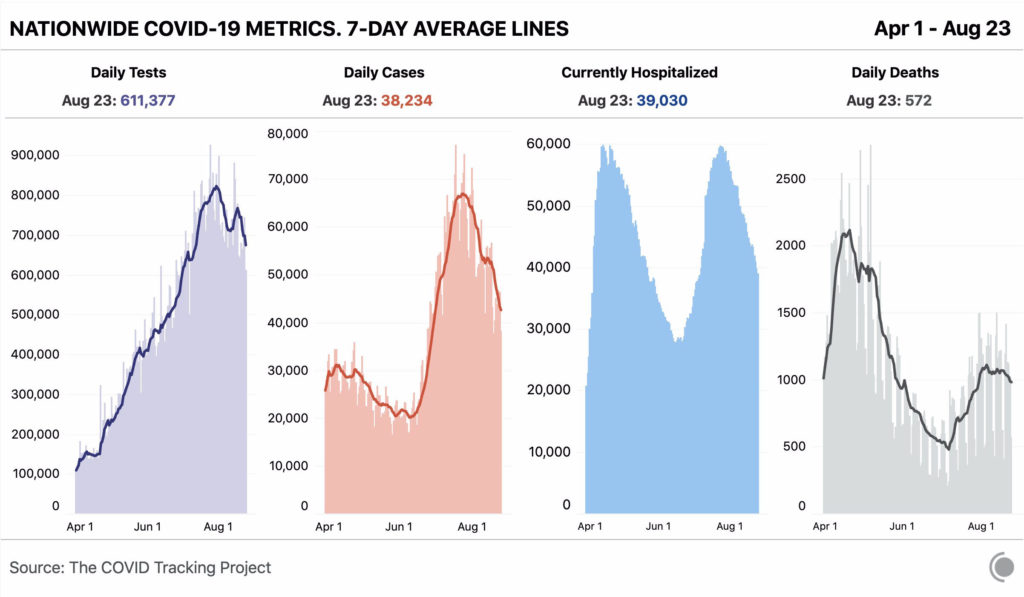
Latest Covid-19 Data
Don’t forget to check out last weeks episode of Forefront’s Friday Fun, and remember “its personal, not just business.”