
Consumers Are in Their Feelings,
But Still Spending
U.S. consumers are in their feelings right now.
Very in their feelings.
If you lived through the early 2000s, you probably remember emo. Short for emotional hardcore. Loud guitars. Confessional lyrics. A lot of angst packed into a few minutes of music. Everything felt heavy. Everything felt personal.
That mood has found its way into consumer sentiment surveys.
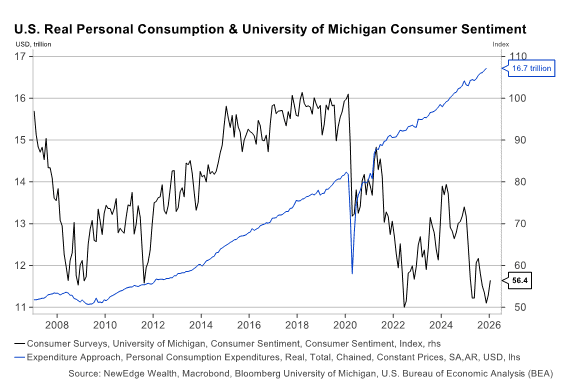
When Americans respond to surveys from the Conference Board or the University of Michigan, they sound like they’re listening to My Chemical Romance’s I’m Not Ok (I Promise) on repeat. Sentiment readings have fallen to levels last seen during COVID and the Global Financial Crisis.
And yet, consumers keep spending.
Personal consumption expenditures are sitting at all-time highs. The same households telling survey takers that everything feels terrible are still shopping, traveling, and spending as if something far more upbeat is playing in the background.
Feeling Bad, Spending Anyway
This gap between how consumers feel and how they act has puzzled just about everyone watching the economy. Even Fed Chair Jerome Powell addressed it directly at the most recent FOMC press conference.
Consumers sound deeply pessimistic in surveys. Then they turn around and spend anyway.
The explanation is simpler than it looks.
Spending data is market-weighted. Sentiment surveys are equal-weighted.
Market-Weight vs. Equal-Weight
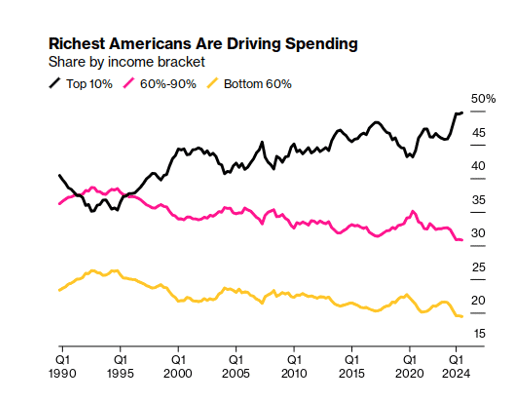
Consumption behaves like a market-cap-weighted index. The biggest contributors matter the most. In equity markets, a handful of large companies can carry the entire index even if much of the market underneath is struggling.
The consumer story works the same way.
Roughly the top 10 percent of U.S. households account for about half of all consumer spending. These households tend to be wealthier, less sensitive to labor market stress, and more influenced by asset prices. When they remain resilient, aggregate spending looks strong even if many households are not.
Sentiment surveys work very differently.
They are equal-weighted. Every response counts the same. The experience of a lower-income household dealing with higher prices and job uncertainty carries the same weight as a higher-income household benefiting from rising stock prices and home values.
That pulls sentiment readings down even while spending stays elevated.
This mirrors what we have seen in markets, where equal-weight indices have badly lagged market-cap-weighted indices over the past few years.
Why Sentiment Looks Extra Bad
There is another important caveat.
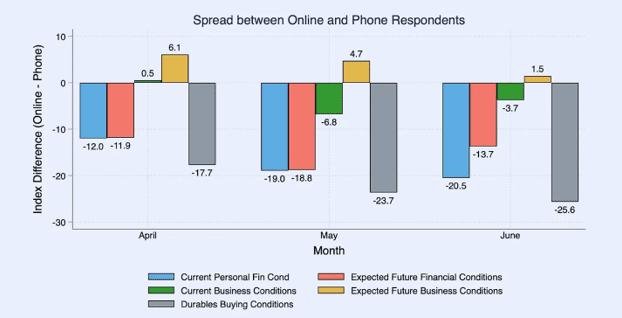
Economists Ernie Tedeschi and Ryan Cummings have pointed out that sentiment surveys experienced a structural break when data collection shifted from phone interviews to online responses. People tend to be more negative when responding online than when speaking to another person.
That shift makes comparisons to pre-2024 data less clean and likely exaggerates how gloomy consumers appear today.
Source: Briefing Book, October 2024
A Recent Shift by Income Level
One more nuance matters.
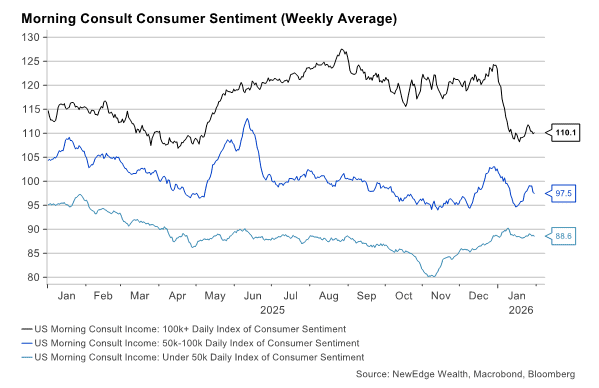
As of January 2026, sentiment among higher-income households has also turned lower. At the same time, sentiment among lower-income households has improved modestly since November 2025, likely tied to the resolution of the government shutdown.
What Economists Expect for 2026
All of this matters when thinking about where consumption goes next.
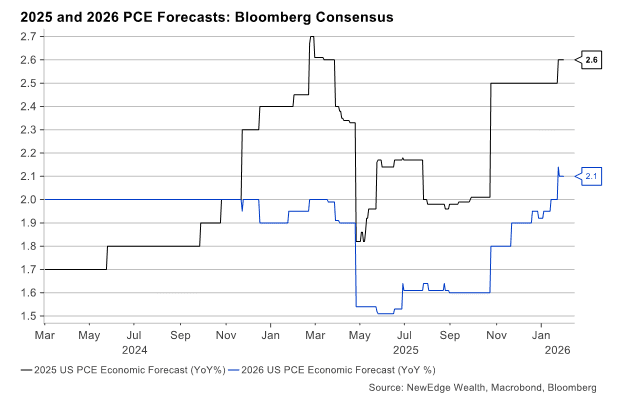
Economists are forecasting a slowdown in personal consumption growth in 2026. Consensus expectations sit around 2.1 percent, down from roughly 2.6 percent in 2025.
That slowdown does not seem unreasonable when you look at how stretched consumers have become.
Spending Has Outrun Income
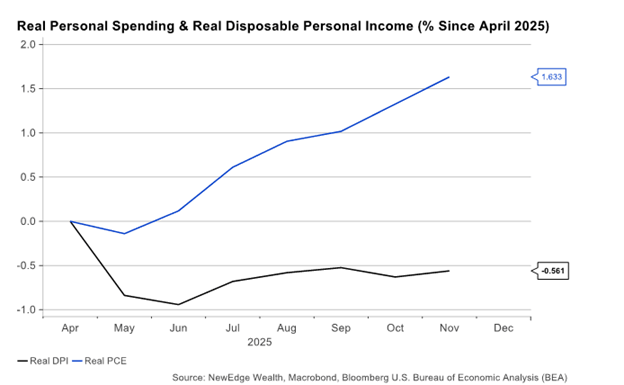
Over the past year, spending has pulled away from income.
Since April 2025, real consumer spending has increased about 1.6 percent. Over the same period, real income has fallen roughly 0.6 percent. Over longer periods, these two measures tend to move together. When they diverge, something eventually adjusts.
The Savings Rate Tells the Story
That adjustment has shown up in savings.
Consumers have been saving less to keep spending up. The personal savings rate has dropped to around 3.5 percent, near historical lows.
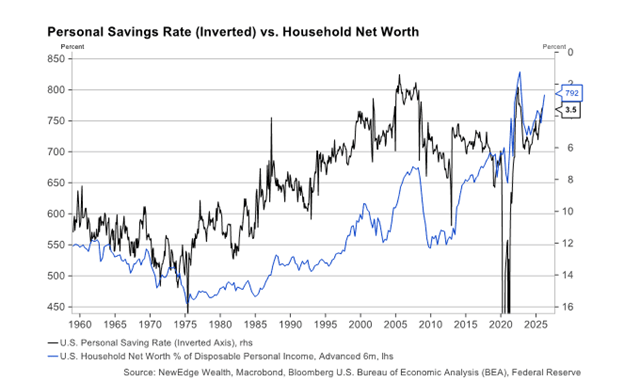
The same data highlights an inverse relationship between household net worth and savings. When households feel wealthier, they tend to save less and spend more.
The Wealth Effect and the K-Shaped Economy
Household net worth is at a record. Stocks have rallied strongly. Home prices have remained resilient. The wealth effect has been a major driver of consumption strength.
But those gains are not evenly distributed.
Higher-income households own most of the assets and benefit disproportionately from rising markets. That has allowed the top leg of the K-shaped economy to continue spending even as the bottom leg struggles.
It has created a positive feedback loop. Strong markets support spending. Spending supports growth. Growth supports markets.
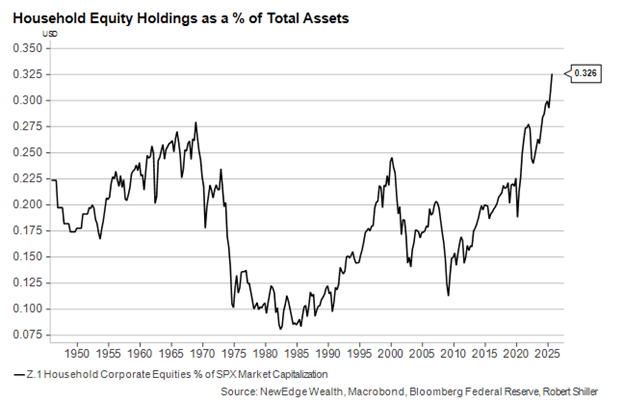
According to the Fed’s Flow of Funds data, households have never been more exposed to equities. That cuts both ways. Rallies feel great. Corrections would likely hit both sentiment and spending.
The Labor Market Still Matters Most
It is notable how long we can talk about the consumer without mentioning jobs.
Higher-income households rely less on wages to spend. Lower-income households depend heavily on labor income. And while consumers can be dramatic about inflation or politics, they tend to be fairly accurate when assessing the job market.
They often sense softening before it shows up in headline unemployment data.
That is why measures like the Conference Board’s Labor Market Differential have been so reliable.
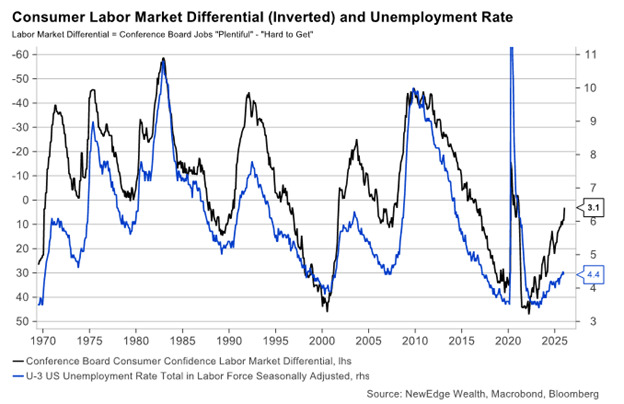
This measure is flashing caution.
Further weakening in the labor market would likely hit lower-income households first. But it would not stop there. A rising unemployment rate would not pair well with an equity market priced for strong earnings growth.
The Big Picture Takeaway
Strong spending data does not tell the full story of the U.S. consumer.
Aggregate consumption looks healthy because it is dominated by households that are still doing well. Sentiment looks awful because it reflects the full range of experiences. The market-weight versus equal-weight dynamic explains much of the disconnect between what consumers say and what they do.
Slower consumption growth in 2026 makes sense given falling real incomes and low savings. How that slowdown plays out depends on whether the wealth effect can continue to support higher-income spending.
For the past several years, the equity market has been the most reliable judge of the consumer. As long as the equal-weight Discretionary versus Staples ratio remains in an uptrend, markets are signaling confidence.
If that trend breaks, the tone changes quickly.
At that point, we may all end up in our feelings.
Sources
Bloomberg
Conference Board, Consumer Confidence Survey
University of Michigan, Surveys of Consumers
Federal Reserve, Flow of Funds (Financial Accounts of the United States)
Federal Reserve, FOMC Press Conference Statements
Briefing Book, Ernie Tedeschi and Ryan Cummings, October 2024
Bureau of Economic Analysis, Personal Consumption Expenditures
Bureau of Labor Statistics, Employment and Labor Market Data
NewEdge Wealth internal analysis
Stock Market Calendar This Week:
| Time (ET) | Report |
| MONDAY, FEB. 2 | |
| 9:45 AM | S&P flash U.S. manufacturing PMI |
| 10:00 AM | ISM manufacturing |
| TBA | Auto sales |
| TUESDAY, FEB. 3 | |
| 10:00 AM | Job openings |
| 9:45 AM | S&P final U.S. services PMI |
| 10:00 AM | ISM services |
| WEDNESDAY, FEB. 4 | |
| 8:15 AM | ADP employment |
| 6:30 PM | Fed Governor Lisa Cook speaks |
| THURSDAY, FEB. 5 | |
| 8:30 AM | Initial jobless claims |
| 10:50 AM | Atlanta Fed President Raphael Bostic speaks |
| FRIDAY, FEB. 6 | |
| 8:30 AM | U.S. employment report |
| 8:30 AM | U.S. unemployment rate |
| 8:30 AM | U.S. hourly wages |
| 8:30 AM | Hourly wages year over year |
| 10:00 AM | Consumer sentiment (prelim) |
| 12:00 PM | Fed Vice Chair Philip Jefferson speaks |
| 3:00 PM | Consumer credit |


About Amit: I am a first generation American, the son of a working-class Indian family, and I lived through my parents’ struggle to find their place in this country, to put down roots that would sustain them as well as their children in a new land. As they encouraged me to excel in school and fostered my hobbies and interests, I was keenly aware of the dynamic between them. I understood that there was a difference between where they came from individually and where we were now. They worked hard in their individual capacities, but they weren’t always on the same page about financial issues – and that can make or break a family’s future. I didn’t know it at the time, but this laid the groundwork for my passion towards financial services and helping families succeed.