by Kevin Kelly
Portfolio Manager
During the first half of 2020, fixed income yields moved substantially, behaving far more volatile than normal and deviating from historical levels of normal volatility (perhaps the understatement of the year!). Consequently, almost every fixed income portfolio has seen the widest swings in principle values since the Global Financial Crisis. All this volatility, combined with the Fed’s actions, resulted in a fixed income market that is extremely different than it has been for the past two decades. But do not worry, we have a plan.
Here is an extreme example of the volatility: The price of one of the largest investment-grade bond ETFs, LQD, declined ~22% in less than two weeks in March. That was an exceptionally large drop for a bundle of high-quality securities, and it highlights the consequence of investors’ rush to cash. A large high-yield bond ETF, HYG, declined 20% in three weeks in March, while a large preferred ETF, PFF, declined 32%. Since their troughs, the investment-grade ETF has fully recovered, while high-yield and preferred ETFs have recovered the vast majority of their declines.
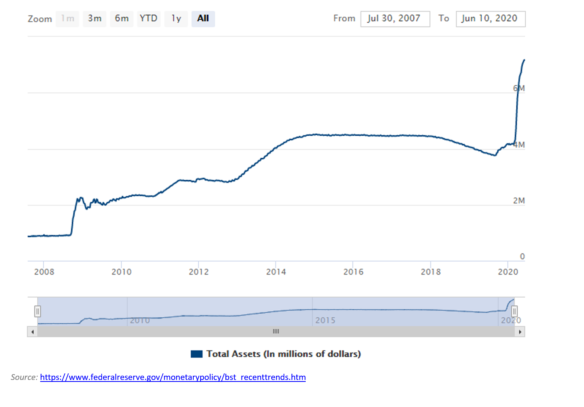
While bond and preferred prices move as yields change, bond investing strategy depends on separating shifts in underlying interest rates from those in credit spreads. The Federal Reserve always has a major influence on short-term rates since it controls the Fed Funds rate (the overnight lending rate for banks). As Covid concerns intensified, the Fed took a series of steps to help the economy. The first action occurred on March 15th as the Fed cut the low end of the Fed Funds target from 1% to 0% and began a $700 billion asset purchase. Since the Global Financial Crisis, and now during the Covid crisis, the Fed’s actions and potential actions have impacted not only short-term rates, but also medium- and longer-term rates through its purchase of Treasury bonds, asset-backed securities, corporate bonds, municipal bonds, and a range of other fixed income securities. The Fed’s asset purchases during the Covid crisis has been both more rapid and substantially larger than during the GFC, as is obvious from the sharp expansion of the Fed’s balance sheet from roughly $4 trillion to $7 trillion, as shown below. These steps, in combination with the Covid-induced recession, drove interest rates lower and made delivering yield to clients much more challenging.
The Federal Reserve’s balance sheet has expanded and contracted over time. During the 2007-2008 financial crisis and subsequent recession, total assets increased significantly $870 billion in August of 2007 to $4.5 trillion in early 2015. Then, reflecting the FOMC’s balance sheet normalization program that took place between October 2017 and August 2019, total assets declined to $3.8 trillion. Beginning in September 2019, total assets started to increase.
In addition to low interest rates, fixed income portfolios were beset by unusually high volatility. Credit spreads, which reflect the difference in yield between a Treasury and corporate bond of the same maturity, are generally the main driver of yields and bond volatility in times of turmoil. Three main drivers of credit spreads are liquidity, investor confidence, and the economic outlook. While the Fed can only do so much to impact the economic outlook, it can do a tremendous amount to impact liquidity in the fixed income market and to shape investor confidence. In 2020, Fed purchases touched an unprecedented range of fixed income securities. These actions allowed companies to raise cash through debt issues and made investors more comfortable holding securities they already own. At a systemic level, this also helped prevent massive forced selling which would have exacerbated the decline in fixed income asset values. Portfolio liquidations can be forced in down markets when investors are subject to margin calls (the companies simply did not have enough cash and other assets to provide the lender assurance that their loan would be paid back in full). This would have set off a vicious cycle of asset liquidations triggering further price declines. The Fed recognized the risk as liquidity evaporated and credit spreads widened across all fixed income markets driving bond prices down dramatically. Therefore, the Fed stepped in to provide liquidity, allowing credit spreads to tighten. In 2008, the Fed failed to recognize early on during the global financial crisis how forced asset liquidation exacerbated market panic. Fed members learned and they acted promptly this time.
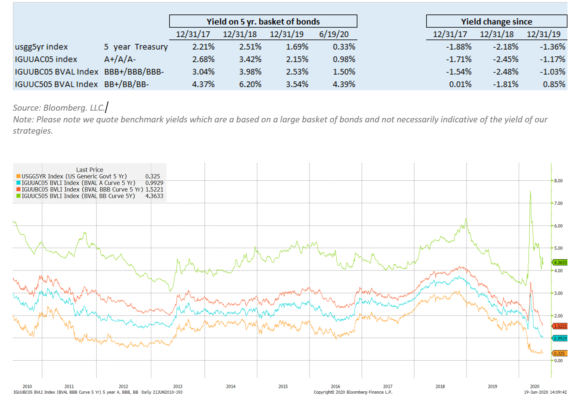
As a result of the series of Fed actions, as well as investors’ demand for safety, interest rates have declined significantly to previously unthinkable levels. The 10-year Treasury bond now yields only 0.7% after starting the year at over 1.9%. The interest rate decline and credit spread tightening have caused yields on 5-year high quality investment-grade securities to fall to extremely low levels: a benchmark that tracks 5-year A+/A/A- rated bonds now yield less than 1% compared to 2.15% at 12/31/19. The BBB+/BBB/BBB- benchmark yields approximately 1.5% compared to over 2.5% at 12/31/19. Among high-yield bonds, yields remain somewhat elevated, as expected, given the significant macro uncertainty.
The table and graph below display the yield on four different 5-year benchmarks; notice that investment grade bond yields are at historical lows:
If these yields are not already shocking, put them into historical context: the average annual returns on investment grade bonds for the past 5, 10, 15, and 20-year periods (ending June 18, 2020) are each over 5% (Based on the Bank of America US Corporate Index Total Return Index Value). Corporate bond yields today are at such low levels that it becomes nearly impossible to replicate those returns over the next 5 years. Interest rates would have to go severely negative for this to happen, and we do not see that in the cards. Note that yields are NOT the same as the coupon rates you see listed on bonds. See the special insert below on coupons versus yields.
Fixed Income Bonus Feature:
Do not let a High Coupon deceive you. Yield and Coupon are VERY different concepts.
We also think it is worthwhile to remind investors that coupons and yields are often extremely different. For example, if you own a bond maturing in one year that that has a 6% coupon and trades at $105, you only net approximately 1% for the year, not 6%. The same holds true if you own a bond maturing in 2 years that trades at $110. You will only earn $2 of interest over 2 years, or approximately 1% per year. (You receive $6 in interest each year for 2 years, but you have paid $112 for the bond and only get $100 back at maturity. Your $12 in coupon payments is largely offset by the $10 decline in value, netting just $2 over the two-year holding period. The same logic applies to a basket of bonds in an ETF if the ETF is paying approximately the coupon as dividends. To help illustrate this point, currently short-term Treasuries yield less than 0.5%, but a short-term Treasury ETF likely may have a distribution yield over 1.25% if the distribution is approximately equal to the coupon. (You can typically find the latest quarterly fact sheet on any ETF you may own online).
Does this mean fixed income investing is dead? No. Not only does fixed income provide stability to a portfolio, it should be possible to generate returns in excess of inflation, as well as grow that part of the portfolio’s purchasing power.
So how can we keep generating attractive fixed income returns when average yields are so low? We are very picky. We select approximately 25-30 carefully vetted securities from our review of hundreds and hundreds of offerings, which allows us to create the potential to generate yields significantly higher than the BBB+/BBB/BBB- benchmark discussed previously. The key is to identify the 25-30 bonds which deliver both attractive yields and acceptable levels of risk. Additionally, we buy select investment-grade preferreds, which provide significant incremental yield, and can be quite attractive on a risk-adjusted basis. Overall, we remain disciplined on credit selection and we will continue to maximize the expected risk-adjusted return for our clients as yields, interest rates, and credit spreads continually change.
ACM is a registered investment advisory firm with the United States Securities and Exchange Commission (SEC). Registration does not imply a certain level of skill or training. All written content on this site is for information purposes only. Opinions expressed herein are solely those of ACM, unless otherwise specifically cited. Material presented is believed to be from reliable sources and no representations are made by our firm as to another parties’ informational accuracy or completeness. All information or ideas provided should be discussed in detail with an advisor, accountant or legal counsel prior to implementation. All investing involves risk, including the potential for loss of principal. There is no guarantee that any investment plan or strategy will be successful. ©ACM Wealth