by Randall Coleman, CFA
Financial websites were abuzz Friday afternoon with the news that Elon Musk had overtaken Warren Buffet on the Bloomberg Billionaires Index. Tesla (founded by Musk) shares popped 10% that day, adding $6 Billion to Musk’s personal fortune. For the year-to-date period, Tesla has gained a whopping 269%. Meanwhile, the world’s preeminent blue blood investor, Mr. Buffet, has seen his shares in Berkshire Hathaway decline -19% since the beginning of the year. This theme is in full swing with technology and growth-oriented stocks climbing and value-oriented stocks languishing. This theme is also driving concentration in the S&P 500 Index toward the high end of the market cap spectrum. Indeed, the top ten constituents of the S&P 500 account for 28% of the index. On the lower end of the spectrum, it takes 395 constituents to make up the bottom 28% of the S&P 500. As a whole, the S&P 500 is almost back to breakeven for the year. This belies the tremendous bifurcation we are seeing in the market. Only 150 stocks in the index are in positive territory for the same time period, meaning 350 are under water. The median stock is down -12.5%. Are we really in an unprecedented environment? How long can it go on?
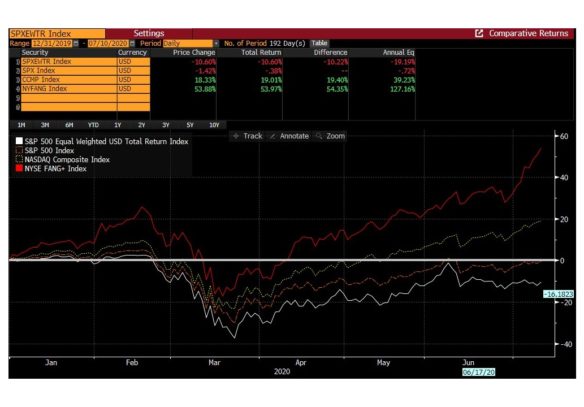
The disparities in performance are truly striking. The equal-weight S&P 500 (not market cap weighted) is down -10.6% year-to-date, while tech-heavy NASDAQ is up +19.0%. Even more pronounced is the so-called “NYSE Fang+” index, which includes Facebook, Apple, Amazon, Netflix, Google (Alphabet), Tesla and a few other tech high fliers. The Fang+ Index is up +54.0% through last Friday. Four out of five of the largest components of the S&P 500 are FANG stocks. If we include MFANG—M for Microsoft—then all top five constituents are captured in the top five. Obviously, performance in 2020 has been concentrated among the mega cap stocks. Their weight in the S&P magnifies their impact because the index is market cap weighted—as the big get bigger, they exert a larger pull. We are hearing a lot of angst-ridden commentary and handwringing among investors regarding this top-heavy risk, but is this necessarily a cause for alarm?
In a word, no. This concentration is not unprecedented. The chart below shows the long-term concentration in the US stock market for three groups: the single largest company, the top five, and the top ten. Clearly, when looking at recent history, we are at a high in concentration at the top. Looking longer, though, it become clear that most of the market’s history has been highly concentrated. By itself, this level of concentration is not a concern.
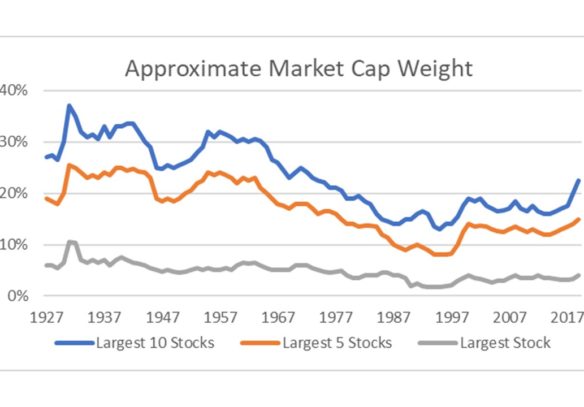
Source: Bloomberg
Much of the worry is driven by memories of The Nifty Fifty which dominated market attention in the 1960s and 1970s. These stocks were characterized by high valuation, high name recognition (Xerox, IBM, Coca-Cola, Polaroid, etc.), continual earnings growth and consistent dividend increases. If we are entering a new “Nifty Fifty” (or should it even be “Nifty Five”?) era, then all other styles will, by definition, underperform. While we cannot predict the future, we can say that we don’t think we’re entering an era of such concentration. Regulators have for years been hammering the MFANG stocks on their anti-competitive nature. Any potential break up of these companies would bring their market representation dramatically lower. Monopolies seldom withstand regulatory pressure for long.
While there will be fits and starts in our recovery, recovery will come. With that recovery, smaller company shares should come to life, closing the performance gap. We are seeing multiple signs of life, signs of recovery. A microchip maker we consider a barometer for market conditions announced this week that it has experienced a large and growing number of orders with little to no lead time, with customers citing improved businesses, and a snapback recovery from the precipitous March/April decline. This company has communicated to its customers that it is pushing out delivery dates as it is not able to meet the sudden demand. Industrial metals demand has also turned up sharply, with price levels already back to where they were trading in November 2019, ancient pre-Covid days.
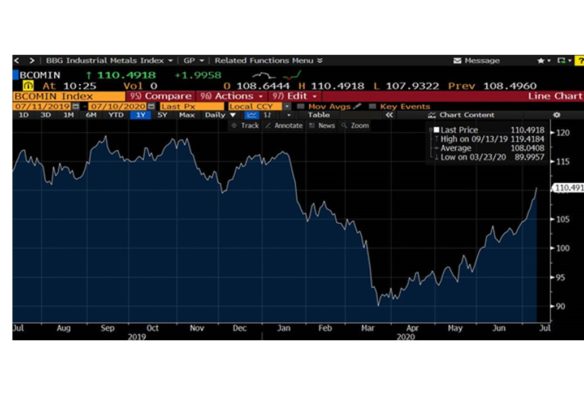
Source: Bloomberg
Tesla reached a market cap on Friday of $286 Billion, nearly 4 times more than GM, Ford and Fiat Chrysler COMBINED, and $86 Billion larger than Toyota, the world’s largest auto manufacturer. We made a very simplistic calculation to put Tesla’s valuation in perspective. We simply divided its market cap by its worldwide vehicles delivered in 2019. This ratio gives the market cap per vehicle sold. Tesla’s ratio is 779,396. That’s almost $800,000 of market cap per vehicle. Toyota’s is $22,377. The average for BMW, Honda, Daimler, VW, Hyundai, GM, Ford, Nissan, Kia and Fiat Chrysler is $7,678. The big may be big and getting bigger, but we don’t believe it will last forever.
ACM is a registered investment advisory firm with the United States Securities and Exchange Commission (SEC). Registration does not imply a certain level of skill or training. All written content on this site is for information purposes only. Opinions expressed herein are solely those of ACM, unless otherwise specifically cited. Material presented is believed to be from reliable sources and no representations are made by our firm as to another parties’ informational accuracy or completeness. All information or ideas provided should be discussed in detail with an advisor, accountant or legal counsel prior to implementation. All investing involves risk, including the potential for loss of principal. There is no guarantee that any investment plan or strategy will be successful. ©ACM Wealth