by David Lieberman
When we wrote our last C19 memo on June 8, we had expected C19 cases to continue a gradual decline. Instead, states with lower case counts reopened early, people were surprisingly complacent, and cases have actually increased sharply in select states, even as cases continued to fall in what had previously been high case states.
But there is still a lot of evidence that longer term we should be able to get ahead of C19 cases. The vast majority of developed countries have improved their case counts. So what makes the U.S. an outlier? For some it appears to be a lack of belief that masks are effective. Others don’t feel that there are enough cases in their region to warrant a major change to lifestyle. Still others have never met or known anybody with C19. All of this contributes to a reduced response allowing the virus to spread in regions where fewer cases had been experienced previously.
Regardless of what is believed, it appears as though states that have gone through high case counts are far more receptive to mask wearing and social distancing. So it follows that the states now seeing spikes in cases will also adjust their behavior in response to that current spike. In time, this will improve case growth and hopefully also flow over to any remaining regions that have not yet suffered a wider impact.
It appears as if many regions and people need to go through a sort of C19 trauma in order to change behavior. This trauma has now expanded to include more locations, so hopefully this will lead to a decline in cases after the increase we’re now experiencing. Nonetheless, at a minimum, we have set the clock back sharply, perhaps by 6 weeks or more with the recent increase in cases nationally and cases are likely to set new highs over the near term.
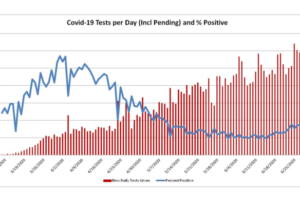
One of the better ways to think about near term case increases is to consider changes in the positive test results from state to state. Nationally, testing continues to increase. But, unfortunately, the percentage now testing positive is also increasing. As I had noted in past C19 commentaries, a declining percentage of positive tests is a strong indicator of future cases reductions. Unfortunately, those reductions have reversed sharply. In fact, the 7-day moving average of those testing positive has hit 6.7%, a level last reached over a month ago. And this average is going to move higher because the percent positive climbed to 7.5% on June 24th and 26th, levels not reached since early May.

Source: Covid Project: https://docs.google.com/spreadsheets/u/2/d/e/2PACX-1vRwAqp96T9sYYq2-i7Tj0pvTf6XVHjDSMIKBdZHXiCGGdNC0ypEU9NbngS8mxea55JuCFuua1MUeOj5/pubhtml#
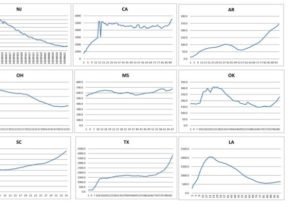
The national data only tells part of the story, because the variance from state to state is very wide. Hospitalization data is a mixed bag. Some states have seen massive improvement, such as N.J., but quite a few have had more recent acceleration in hospitalizations. But many others are now seeing increasing hospitalizations in addition to increased cases. Note that the horizontal access shows the number of days from the start of reported hospitalization rather than the calendar date.

Source: Covid Project
A substantial number of countries have been able to open their economies without increasing infections, with Japan as the best example. But in Japan, everybody wears a mask, they have a thorough tracing program, and they are more inclined to follow health guidelines, referred to there as the 3Cs: https://www.mhlw.go.jp/content/10900000/000615287.pdf
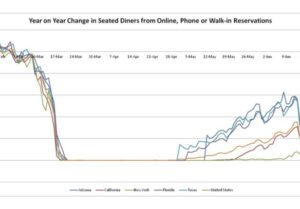
JPMorgan also recently noted that states where restaurant visits had increased the most correlate well with the sharpest case increases 3 weeks later . Rather than being the cause, it is likely that restaurant visitation reflects general behavior towards wearing masks. Nonetheless looking at the data provided by OpenTable, we can see that the states that have seen an increase in cases more recently have started seeing a flattening or declining number of seated diners. Still this change has only been modest and doesn’t suggest a major drop as happened in March. Masking remains the unknown and is a key element to reducing cases. New York has also been included for reference since its improvement has continued.

Source: Open Table
If there is a bright spot, it is that the average age of those infected has been declining, sharply in some states. The average age of someone who was confirmed to have been infected with C19 in Florida has declined from 65 years old for the week ending March 1st to 35 years old by June 14th. That’s an incredible 30 year decline in the average age of someone infected and suggests that the number of hospitalizations per infection and the number of deaths per infection could decline quite sharply.
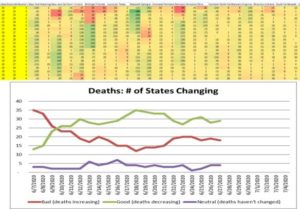
So far, deaths have not increased that much. This is the 7 day trailing heat map of deaths. Green indicates improving rates, while red shows those getting worse. It is important to note that deaths lag cases by about 2 weeks. But keep in mind that the fatality rate is much lower for young people so we may not see deaths climb nearly as sharply as cases given the average age decline in Covid cases. Still on a national level deaths are likely to start climbing again as the 7 day moving average (column right next to the date on the left) is close to turning positive.

Source: Worldometers.com’
Regardless of which set of data you look at, C19 is going to be here for a while and this underscores how important it is to take precautions to continue to minimize the spread of the virus. When the cold weather inevitably returns and we’re forced indoors more, the importance of masking will only grow. In the meantime, we’re likely to see cases increase in the near term, because most indicators now suggest more states are experiencing increased problems as they reopen. It wouldn’t be surprising to see daily cases in the U.S. surpass 50,000 daily. Hopefully, the public has had enough negative experience with C19 that behavior will change and ultimately reduce case counts. Right now, evidence does not suggest that change will yet happen in a strong enough way to make a major impact, but at least the restaurant data indicates that on the margin it is beginning.
ACM is a registered investment advisory firm with the United States Securities and Exchange Commission (SEC). Registration does not imply a certain level of skill or training. All written content on this site is for information purposes only. Opinions expressed herein are solely those of ACM, unless otherwise specifically cited. Material presented is believed to be from reliable sources and no representations are made by our firm as to another parties’ informational accuracy or completeness. All information or ideas provided should be discussed in detail with an advisor, accountant or legal counsel prior to implementation. All investing involves risk, including the potential for loss of principal. There is no guarantee that any investment plan or strategy will be successful. ©ACM Wealth

