 by David Lieberman
Source: ACM
 United States
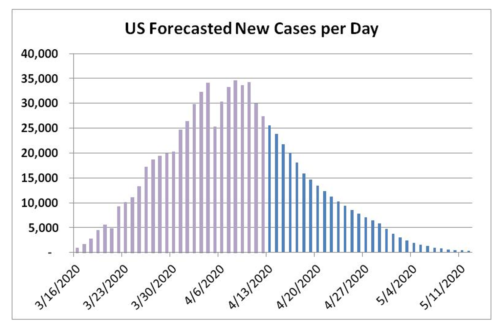
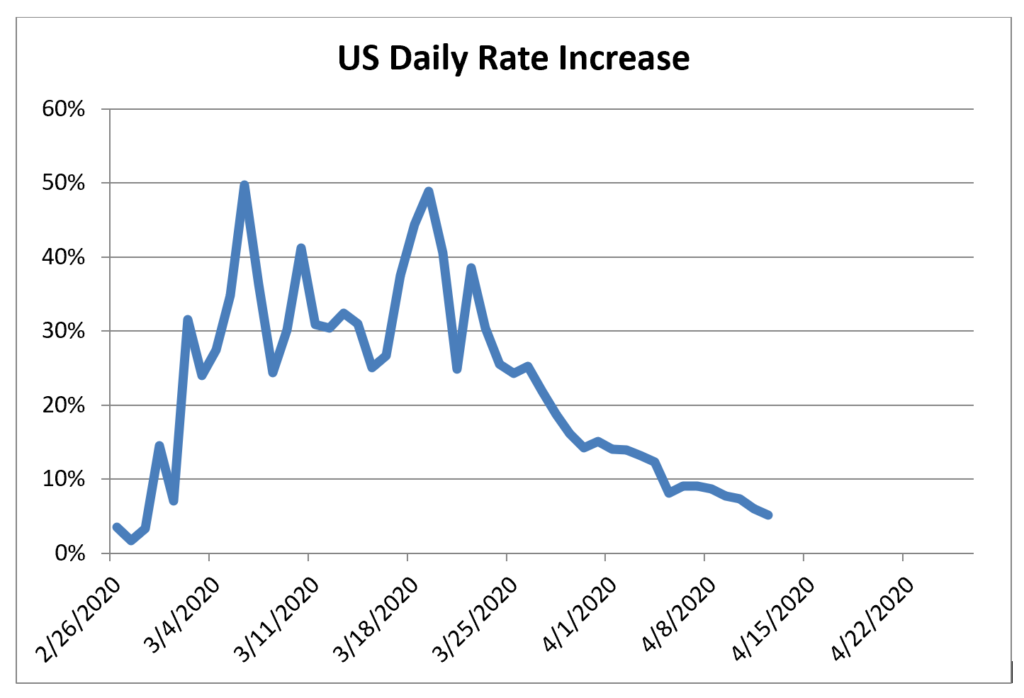
• It looks like case count has indeed peaked with cases falling to 27,000 yesterday. Case growth grew only 5.1% on Sunday down from 6.0%, 7.3%, 7.7%, and 8.6% the prior days.
• The overwhelming majority of states are now showing slowing case count with 45 states out of 51 territories showing a slower rate of growth in the past 4 days vs. the prior 4 days. No state grew over 20% and only 2 states had a growth rate of over 12% (RI, SD).
• Only 5 states had a growth rate over 10% and 27 states had a growth rate of over 5% down from 17 states and 42 states respectively on Thursday.
U.S. Forecast Summary
• Hospital demands appear to be close to peaking and in a few locations may be just past peak.
• The case fatality rate (CFR%) came in lower than expected this weekend leading to a lower over CFR% forecast.
• The decline in cases should continue this week. The forecast in the US has decreased to a little over 800,000 total cases and 60,000-65,000 deaths. Deaths may also have peaked.
• When might we be under 1,000 cases nationally per day? I will update this each day but it has remained the first half of May with May 7th as the estimated date; this is one day earlier than the estimate a week ago.
International
• Case count growth continues to slow. Globally case count growth grew 4.1% yesterday down from 4.8% and 5.9% the prior two days.
• We are seeing broad improvement in the overall numbers. Case count is clearly slowing significantly across the world. None of the 35 countries tracked had daily case growth over 11% yesterday.
• Nearly all countries in the world are seeing a broad based slowdown with only 3 countries out of 165 showing more than a 20% growth rate and only 10 countries showing more than a 10% growth rate. This is down from 7 countries and 34 countries respectively on April 9th.
How Are Hospital Needs Peaking When Cases are Still Climbing?
The diagnosed cases are delayed, by at least several days and often longer. I know of a healthcare worker that was tested this past Tuesday and still does not have results as of Sunday. This is a test for a healthcare worker, which should be given a higher priority to allow them back to work, if they are negative. Yet even these cases are severely delayed by processing backlogs. Other patients aren’t even being testing with the testing response so poor. Testing capacity in the US has only increased about 25% from 2 weeks ago. As a result, patients are finding their ways into hospitals for C19 before their diagnosis comes back, if they were even tested at all. The result is that hospital demand and case demand are peaking at nearly the same time.
Risks of a Second Wave: Asia – No Second Wave Yet Emerging
With case counts turning in most of the world, focus will shift towards whether there will be a second wave in cases. China has seen an increase in cases and they claim that this increase is overwhelmingly from imported cases. China has locked down its bordering region with Russia in order to prevent a wider spread from imported cases. This may or may not be true, but tracking their case count is worth tracking to see whether a second wave is emerging. Aside from China, most other countries in Asia look like they are eliminating cases.
 Source: ACM
Risks of a Second Wave: Europe: A comparison of Two Types of Country Responses
Economically Open – Sweden: Has remained economically open throughout the crisis Closed But Partially Opening This Week – Austria, Denmark, Czech Republic, and Norway (D.A.N.C)
Sweden and Austria have taken completely different paths to tackle the virus, but both will offer valuable insight into choices that should be made about the future. Sweden has kept their economy open, while Austria is going to be one of the first European countries to open up its economy again, as early as next week. Denmark, the Czech Republic and Norway have plans to open soon as well.
Sweden remains one of the few countries in the world that has kept their economy open. Restaurants and schools remain in session while recommending social distancing. The growth rate of C19 has clearly slowed, but not nearly as much as the rest of Europe. The daily growth rate in Sweden has actually been flat for almost 4 weeks now and has fluctuated around 8% daily over that time in comparison to the rest of Europe, which is now growing around 5% or less. Still, in the past couple of days Sweden’s case growth has also slowed. We’ll monitor if it continues.
While Sweden’s government has not mandated any sort of shutdown, people’s behavior has changed dramatically. According to Citymapper, mobility is down 70% in Stockholm.1 This is a sizeable decline even if it doesn’t match the 90% plus of most worldwide cities. Some parents have also kept their kids home from school even at the threat of facing discipline.
This unique situation raises several key questions:
• Will the individual behavioral changes be enough to slow and ultimately stop the spread of C19 in Sweden?
• Will it slow enough to ensure that it doesn’t risk overwhelming the Swedish medical facilities?
• How much less damage will these policies have on the Swedish economy, particularly if individual behavior isolates anyway?
• Some have speculated that Sweden’s choice is more of an attempt to keep cases low enough to avoid overwhelming hospitals, while allowing herd immunity to build up. Is this the correct strategy?
Austria and the rest of DANC have locked down and cases have fallen dramatically. But they each plan to gradually open their economy starting this week. Cases have slowed to 300 new cases daily in Denmark down from a peak of over 1,000. Small shops will be permitted to open starting on April 14th as well as large DIY stores and garden centers. On May 1, other slightly higher risk businesses will be permitted to open, including hair salons, for example. Restaurants may be permitted to open starting in mid-May. Schools will remain closed and facemasks will continue to be required.
This gradual opening schedule may serve as a blueprint for the US and other countries.
We’ll track the performance of these European countries here to see how they are performing. Sweden’s slow increase in cases stands in contrast to the recent declines of DANC.
 Source: ACM
How Fast Might an Economic Recovery Be?
Since World War II there had been 11 recessions before 2020. The structure of the US economy has changed dramatically over that time, but those changes might be very helpful to assess how this recession may unfold.
In the 30-40 years after WWII, the US economy was overwhelmingly a manufacturing based economy. The service sector, which included businesses such as leisure, travel, and health care developed later as disposable incomes increased. Today the service sector makes up nearly 90% of the US economy. But this change had a profound impact on the shape of a recession.
The graph below shows the percent of job losses in post WWII recessions. Virtually all recessions prior to 1981 were V shaped. The 1981 recession was a bit of a blend between a V and a U, while the recessions that came after 1981 were all U shaped.

V shaped recessions make a lot of sense during a manufacturing based economy. Imagine that you are the CEO of an automobile manufacturer. The economy begins to weaken and you are forced to make a decision –terminate all members of the assembly line and cease to make any more automobiles or keep the entire line and continue to produce excess inventory. There is no option to only reduce employment gradually since the assembly line needs virtually all employees on the line in order to continue to make the vehicles. The result is that the manufacturer tends to wait too long before letting everybody go. When inventories become excessive, they furlough workers and shut down until inventories are depleted. When excess inventories clear, which can happen rapidly since a lot of automobile production has ceased, and as the economy begins to improve the plant needs to hire everybody back all at once contributing to a sharp improvement in the economy.
This sharp decline and subsequent rebound is a structural function of a manufacturing economy, but is not evident in a service based economy. Imagine a hotel that sees a slowing rate of reservations. They can see this slowing in advance and can gradually reduce staffing one by one over time to accommodate the slowed reservations. The opposite is true as things rebound. This very gradual decline and rebound is what tends to create a U shaped recovery and is why all recessions since 1981 have resembled this shape.
This brings us to the C19 recession. In this case layoffs were incredibly swift, especially for certain industries like hotels, restaurants, and retail stores. Many stores have furloughed the vast majority of their store employees. Once reopened, however, many of these employees will likely need to be rehired. No doubt some stores will close permanently and even those that remain seem unlikely to hire back as many employees as they had in the past. But the rehiring will still be rapid when a store opens.
Even if stores are likely to be permitted to open somewhat gradually with certain stores opening before restaurants, perhaps as much as 2-8 weeks earlier, this comparison to a manufacturing economy is relevant. The hiring needed to support these openings should be substantial and should allow for this very steep decline in employment to be partially reversed by a very steep recovery in hiring unlike what we have experienced in other recent recoveries. The financial support from the US government to bridge this volatile period of time will also help, because companies who are not mass-furloughing many employees are incented to maintain their entire staff for a few months with financial support from the U.S. government.
Combined this should help this recession recover much more rapidly than any recent recovery we’ve experienced, provided there is no major impact from a second wave, such as the need to shut down again.

 Source: ACM

IMPORTANT DISCLOSURE:
Unless otherwise noted data driven in graphs is from https://www.worldometers.info/coronavirus/#countries. Projections are that of the author how is a member of the ACM investment committee. Views expressed are as of the date indicated, based on the information available at that time, and may change based on market and other conditions. Unless otherwise noted, the opinions provided are those of the author(s) and not necessarily those of Advisors Capital Management or its affiliates. Investment decisions should be based on an individual’s own goals, time horizon, and tolerance for risk. These materials are provided for informational purposes only and should not be used or construed as a recommendation of any security, sector, or investment strategy. Past performance and dividend rates are historical and do not guarantee future results. Investing involves risk, including risk of loss. Diversification does not ensure a profit or guarantee against a loss.